How to Use LawAtlas
Here we walk you through the different features of our data pages and how to use them.
Watch our Quick Start video
Exploring the data
The legal data displayed in the maps and tables on LawAtlas.org are created using scientific legal mapping techniques that use a question-and-answer format to identify the nuanced differences and similarities present in the text of laws and policies. Learn more about how to do scientific legal mapping.
We use those same questions and answers to help you explore the data.
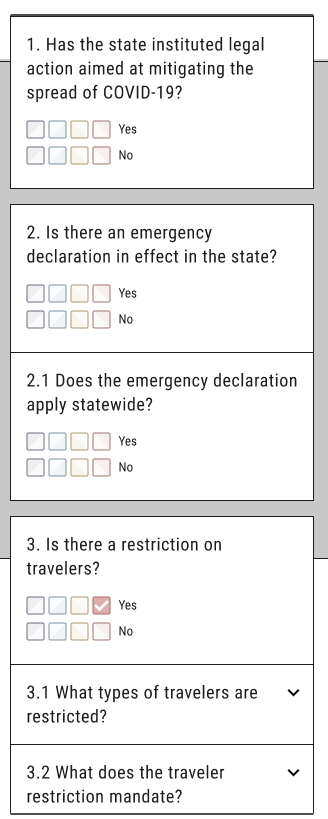
On the right side of any data page there are expandable question boxes with answers you can select based on your interests. Depending on the mode you use to make selections (Comparison mode or Filter mode), the map or table will change to display the jurisdictions that meet those criteria.
Comparison mode and Filter mode
There are two different ways to explore the data on LawAtlas.org data pages: Comparison mode, which allows you to see jurisdictions that meet any of the criteria you’ve selected, or Filter mode, which shows you only the jurisdictions that meet all the criteria you’ve selected.
Select the mode using the toggle on the top right of the map or table.
Watch our video tutorial:
Comparison Mode
In Comparison mode, the selections indicate that the jurisdictions on the map have any of the answers, or variables, you’ve selected. This is what data science calls an “or” query. As in, I want to see where this OR this is present.
You can assign a color to a variable or to a collection of variables to see how they compare across the jurisdictions. There are four color options: red, yellow, dark blue, and light blue.
Clicking the color box next to the answer choice will assign that color to that answer. Clicking the box again will deselect the color.
The tables in Comparison mode will show you a list of the selections you’ve made and where they apply to the jurisdictions.
Filter Mode
In Filter Mode, as you select different answers, the map or table will display only jurisdictions where all the selections are present in the laws. This is an “and” query. As in, I want to see only where this AND this are present at the same time.
This map will be one color (yellow). The table will show a list of jurisdictions that meet only those selected criteria.
Exploring longitudinal data
Some datasets on LawAtlas.org include information about laws and policies at one point in time (called cross-sectional data), others include information about laws and policies as they have changed over a period of time (called longitudinal data).
On dataset pages displaying longitudinal data, timeline bars will appear below the map or table corresponding to the selections you’ve made among the variables (regardless of whether you’re filtering or comparing). These timeline bars show the adoption of that law or policy (or collection of laws or policies) over time.
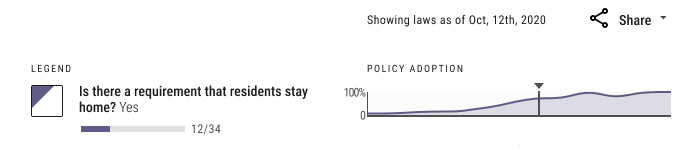
To see how the landscape has changed at a different point in time, click on the black arrow above the time bar, and slide it left or right — left to see earlier, right to see later in time. The map and table will change to display where that variable appears at that point in time.
Jurisdiction Profiles
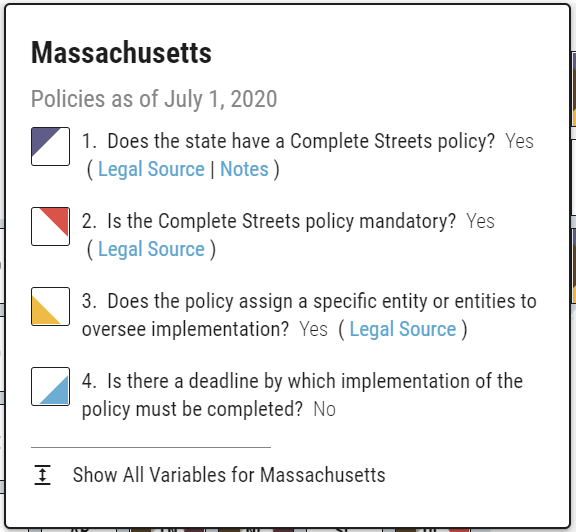
To view the questions and answers for one specific jurisdiction, you’ll want to access the Jurisdiction Profile. These profiles offer a full list of questions collected in the data, the answers to those questions for the laws from that jurisdiction, access to the legal source related to that answer, and any notes from the researchers about the answer or legal source.
To access the jurisdiction profile in the map view, click on the jurisdiction tile.
To access the jurisdiction profile in table view, click on the name of the jurisdiction.
If you have made selections among the answers on the right side of the page, the Jurisdiction Profile will show those questions, answers, the legal source, and any notes at the top. Clicking “Show All Variables” will reveal the full list of questions and answers.
If you have not made selections, the profile will show the full list of questions and answers in the same order as in the right answer selector pane.
Viewing the legal text
There are two ways to find the legal source and read the legal text for each answer in each jurisdiction.
The first way is to click “Legal Source” next to the answers in the Jurisdiction Profile. Clicking Legal Source will expand the box to show you the legal citation(s) and an excerpt of the legal text that corresponds to that answer. Clicking “View Full Law” will take you to the Legal Text Box for that answer, which displays the full text of the law that corresponds to the answer in that jurisdiction.
The second way is to click “View Details” in the table. This will take you directly to the Legal Text Box for that answer.
Researcher Notes
Researchers may use Notes to convey important information about the way a question was answered or how the law may be implemented in practice. For example, the researchers may want to explain why a question was answered a certain way, or they may want to notify users that the answer is a unique response appearing only in that jurisdiction, that laws in that jurisdiction may contradict each other, or that the law has been enjoined (or made unenforceable) by a court decision, among other reasons.
Notes will appear next to the Legal Source button in the Jurisdiction Profile box and can be expanded or collapsed by clicking the word “Notes”.
Downloading the data
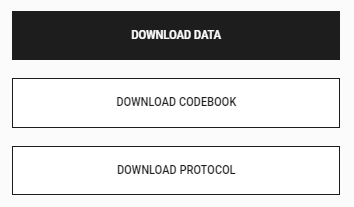
Our mission is to provide free, open access to high-quality legal data. To that end, every dataset is accompanied by a downloadable .csv export of the full dataset, and documentation that provides detailed information about how to read the data (codebook) and how the data were created (protocol). These downloads can be found below the map or table for each dataset.
To download these resources, we ask that you create a profile on our site. Each time you seek to download the data, protocol or codebook for a dataset on our site, you will be asked to log in. This account is free.
Overlapping Datasets
There are many related and overlapping topics in the library of data on LawAtlas.org, and there may be times when it would be helpful to see the questions and answers from a dataset or two, or more, together on the same map or table. Our Overlapping Datasets feature gives users the ability to add one or more datasets to the map or table they’re already viewing.
This feature is only available on datasets where there is currently at least one other dataset in the LawAtlas library that meets two conditions:
- The datasets have the same geography (e.g., they both cover the same 50 states or the same 40 cities);
- The datasets cover the same timeframe (i.e., they are valid through the same date or cover the same longitudinal period).
If there is at least one other dataset that meets those two conditions, a button will appear below the question and answer pane:

Click “Add an Overlapping Dataset” and then select the other dataset(s) you would like to add. Then, click anywhere else on the screen to close the window and show the updated map and table.
Note that the data, codebook, and protocol will be those documents associated with the original dataset. To view the documentation for the other overlapping data, you will need to visit those dataset pages directly.
This advanced feature can only be accessed by users who have logged into LawAtlas.org using their free account.
Sharing LawAtlas data
There are a few ways to share resources from LawAtlas.org. Each dataset page has two buttons below the map or table:

Clicking the left button will provide you with the URL for the map or table you’re currently viewing.
The right button will download a .png file of the map or table you’re currently viewing, along with the legend.
